



In the meeting room, poverty looked like something that could be counted. There were percentages that had to be decreased, poverty line became the borderline, number of households to focus on, priority areas to be mapped, and targets of extreme poverty elimination. The government brought data to know who were poor, where they lived, and what programs to implement.
All those were important. The issue was when the number was deemed sufficient to explain somebody’s life. For poor people, poverty did not come in percentages. It was there when daily wage was not enough to buy basic necessities. It was there when households needed repair, children needed to pay school fees, family members got sick, employment was only available in informal sector, or when urgent needs forced other needs to had to give way to other needs had to put on hold.
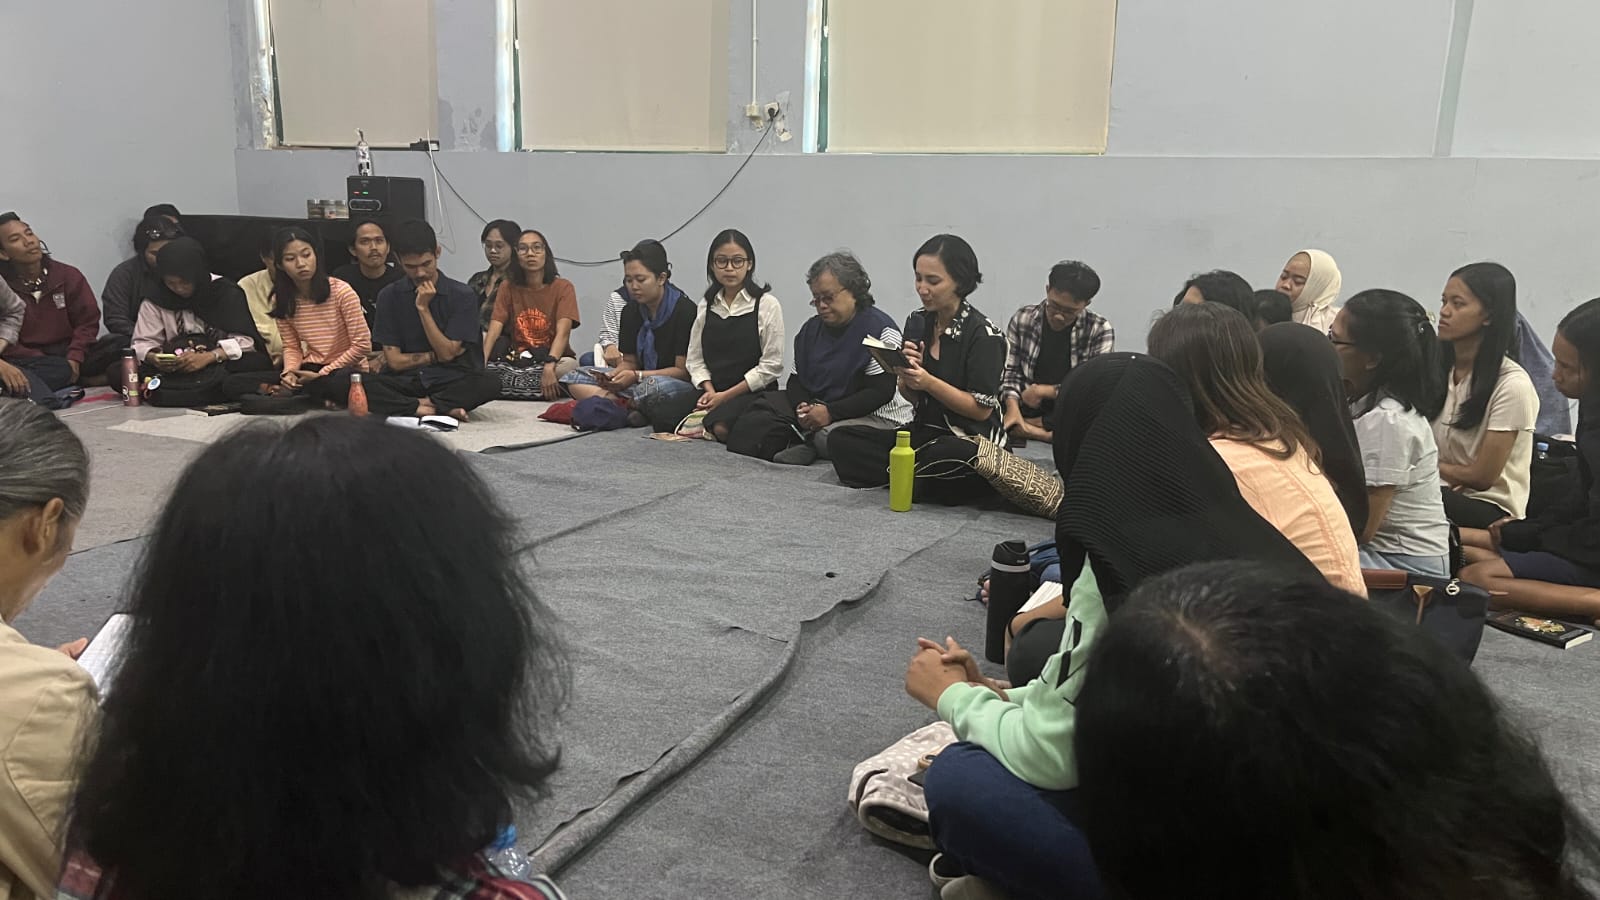
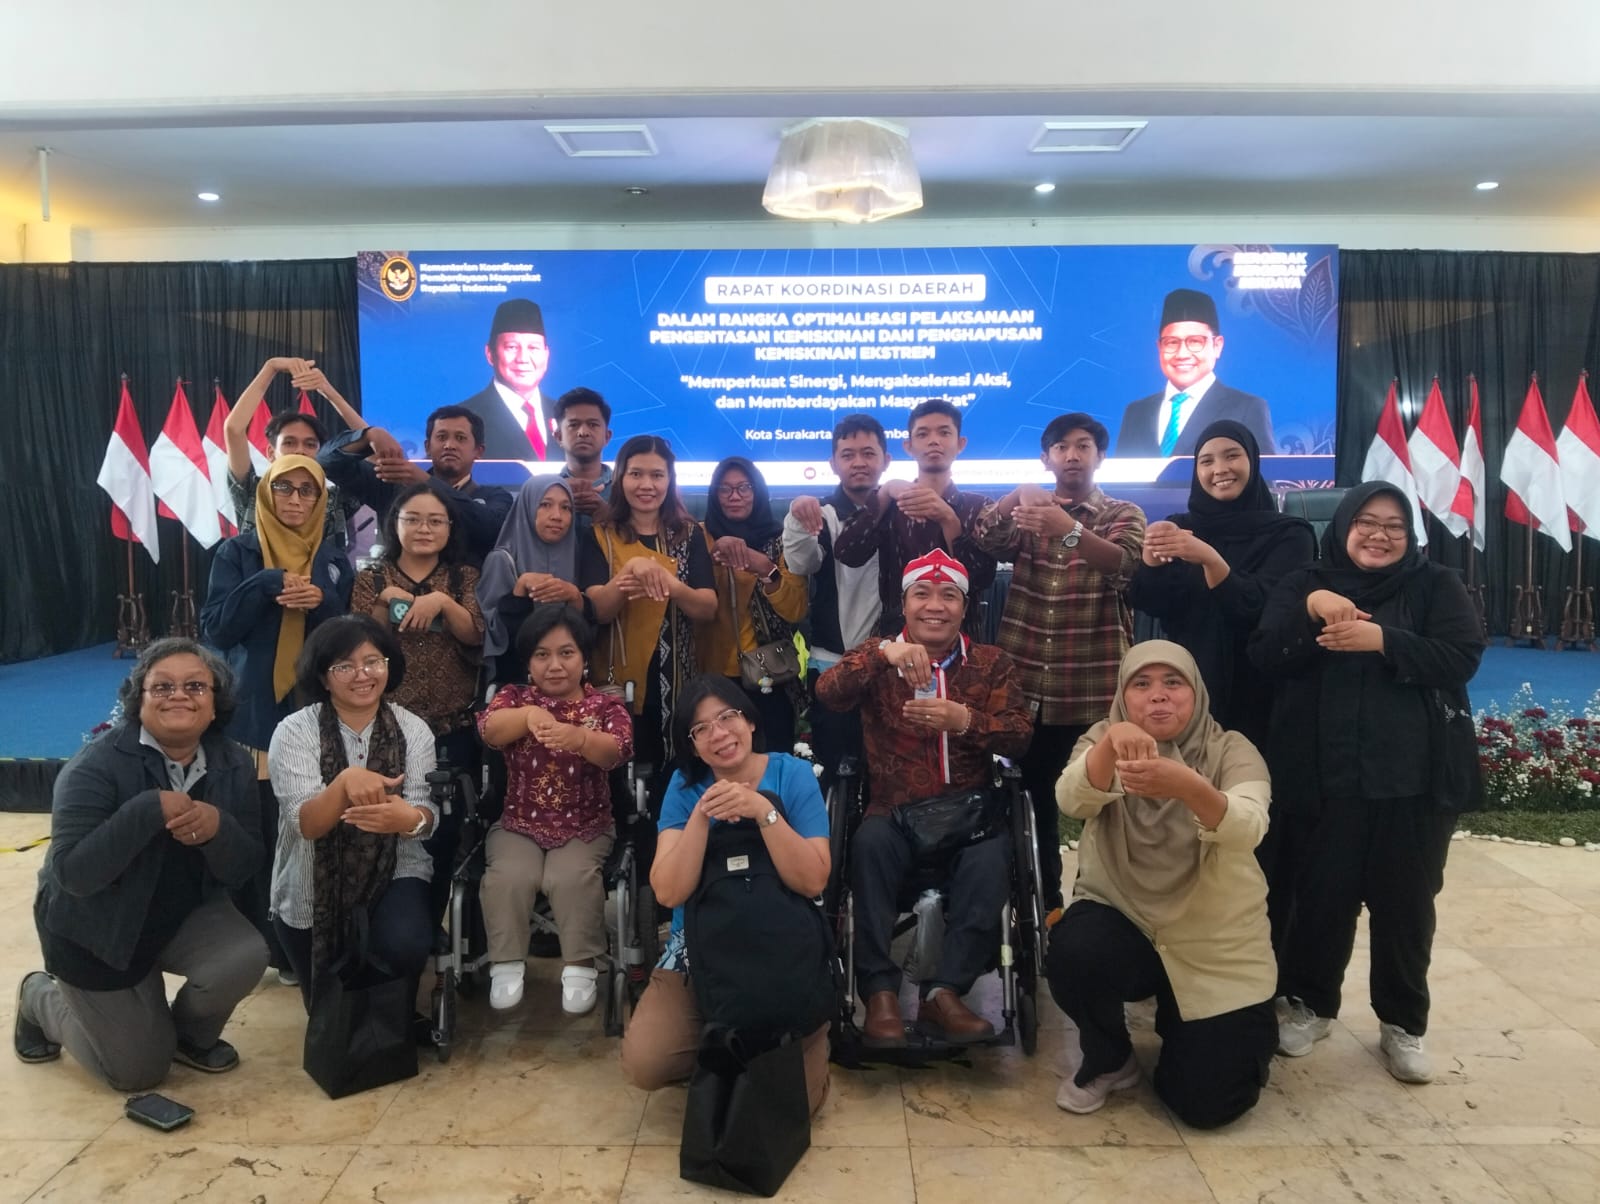
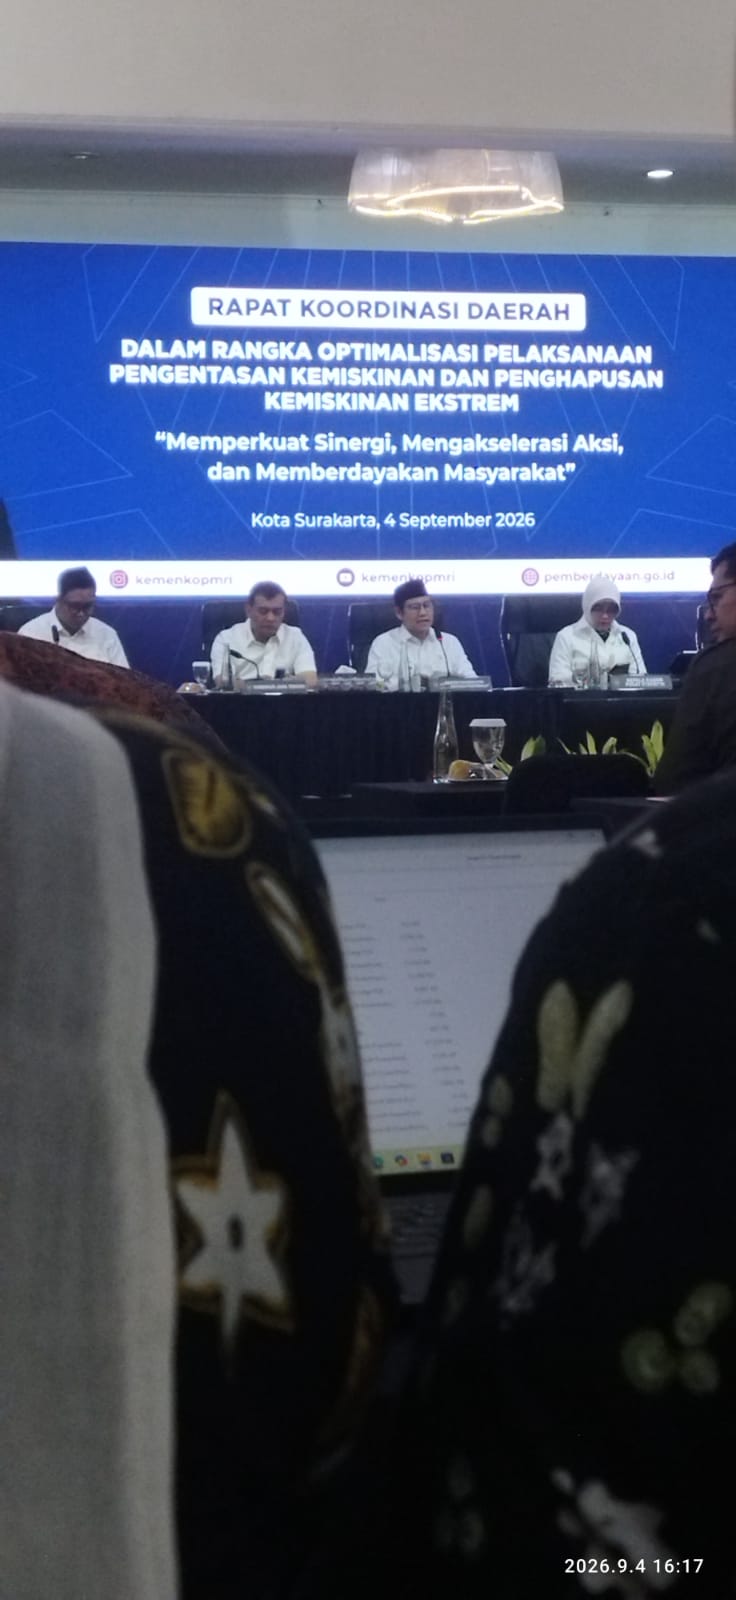
That illustration came up during the Sub-national Coordination Meeting for Optimising implementation of Poverty Eradication and Elimination of Extreme Poverty that brought together national government, sub-national governments, State institutions, parliament, academics, and philanthropy organisations and institutions at Graha Wisata, Solo, on Friday (4/9).
The meeting showed how important data was in poverty eradication policy. The National Bureau of Statistics data used data to read the number of poor people, the depth of poverty, poverty level, employment characteristics, and education level. There was a major target to achieve. National poverty had to be suppressed to around 5–6% in 2029, while extreme poverty had to be eliminated. The numbers gave the direction. But for the people who faced poverty on daily basis, the simpler question was critical: whether the data truly reflect their life?
In the meeting, the issue about data kept appearing. National and sub-national governments had to synchronise data. Sub-national governments had their own data, while the National Bureau of Statistics used statistical methodology to measure poverty. The differences had to be synchronised to avoid mistargeting. Academics urged the use of data at individual, household, and village levels. Digital mapping and WebGIS could help the government see the potentials and the problems in more detail.
The idea was important. Villages did not just contain poverty numbers. In one household, for example, there could be parents who worked as farm labourers with non-fixed income, children still at schools, family members needing health services, and house needed repair. Two households classified as poor might not face the same problem.
One household might have employment but the income might not be stable. Another household might not have any employment at all. A household might have its own house, but the house was sub-standard. Another household might have a house with better condition but lacked access to water, education, health, or descent transport. When all these families were group in the same category, the differences in poverty experience might become blurred.
Data could indeed show who were poor. Yet, data did not know why they remained poor, and the government needed more stories than the numbers.
The National Bureau of Statistics explained two key measures – depth of poverty and severity of poverty. Depth of poverty showed the average gap between expenditure amongst poor households in comparison to the poverty level. Severity of poverty looked at gaps in conditions amongst poor people. That measure helped the government know that poverty was not only about the number of poor people. There could be people just below the poverty line. There could also be people who had far worse condition. For people with meagre income, the differences were real.
When food prices increased, households might decide to compromise food quality. When a child needed school equipment, other needs would be postponed. When someone got sick, income might stop for a while, but expenditure continued. Poverty did not mean that a person did not work.
Data presented in the forum showed that around 40.5% heads of household worked in the agricultural sector by March 2026. Around 63.24% worked in informal sector. While around 68.72% had elementary school education or lower. The numbers showed one important thing: employment did not take people out of poverty.
A peasant might work all day and found it difficult to fulfil household needs. Informal workers could have an income one day, but might not have income certainty for the next day. For that reason, it was not enough for poverty eradication to simply say that employment opportunities were available.
The next question was, what kinds of work, what was the income from that work, and how safe were their employments?
All those were important. The issue was when the number was deemed sufficient to explain somebody’s life. For poor people, poverty did not come in percentages. It was there when daily wage was not enough to buy basic necessities. It was there when households needed repair, children needed to pay school fees, family members got sick, employment was only available in informal sector, or when urgent needs forced other needs to had to give way to other needs had to put on hold.
That illustration came up during the Sub-national Coordination Meeting for Optimising implementation of Poverty Eradication and Elimination of Extreme Poverty that brought together national government, sub-national governments, State institutions, parliament, academics, and philanthropy organisations and institutions at Graha Wisata, Solo, on Friday (4/9).
The meeting showed how important data was in poverty eradication policy. The National Bureau of Statistics data used data to read the number of poor people, the depth of poverty, poverty level, employment characteristics, and education level. There was a major target to achieve. National poverty had to be suppressed to around 5–6% in 2029, while extreme poverty had to be eliminated. The numbers gave the direction. But for the people who faced poverty on daily basis, the simpler question was critical: whether the data truly reflect their life?
In the meeting, the issue about data kept appearing. National and sub-national governments had to synchronise data. Sub-national governments had their own data, while the National Bureau of Statistics used statistical methodology to measure poverty. The differences had to be synchronised to avoid mistargeting. Academics urged the use of data at individual, household, and village levels. Digital mapping and WebGIS could help the government see the potentials and the problems in more detail.
The idea was important. Villages did not just contain poverty numbers. In one household, for example, there could be parents who worked as farm labourers with non-fixed income, children still at schools, family members needing health services, and house needed repair. Two households classified as poor might not face the same problem.
One household might have employment but the income might not be stable. Another household might not have any employment at all. A household might have its own house, but the house was sub-standard. Another household might have a house with better condition but lacked access to water, education, health, or descent transport. When all these families were group in the same category, the differences in poverty experience might become blurred.
Data could indeed show who were poor. Yet, data did not know why they remained poor, and the government needed more stories than the numbers.
Day-to-Day Poverty
The National Bureau of Statistics explained two key measures – depth of poverty and severity of poverty. Depth of poverty showed the average gap between expenditure amongst poor households in comparison to the poverty level. Severity of poverty looked at gaps in conditions amongst poor people. That measure helped the government know that poverty was not only about the number of poor people. There could be people just below the poverty line. There could also be people who had far worse condition. For people with meagre income, the differences were real.
When food prices increased, households might decide to compromise food quality. When a child needed school equipment, other needs would be postponed. When someone got sick, income might stop for a while, but expenditure continued. Poverty did not mean that a person did not work.
Data presented in the forum showed that around 40.5% heads of household worked in the agricultural sector by March 2026. Around 63.24% worked in informal sector. While around 68.72% had elementary school education or lower. The numbers showed one important thing: employment did not take people out of poverty.
A peasant might work all day and found it difficult to fulfil household needs. Informal workers could have an income one day, but might not have income certainty for the next day. For that reason, it was not enough for poverty eradication to simply say that employment opportunities were available.
The next question was, what kinds of work, what was the income from that work, and how safe were their employments?
Descent House Was Not Simply about Non-leaking Roof
Non-descent houses were issues discussed by sub-national governments. The house renovation program could be important intervention. Safer and healthier houses could reduce health risks and provided descent environment for the families. Yet, for descent houses, one had to also look at the people living in those houses.
House deemed finished for renovation might not address all of a household’s problems. Families might still face the costs of electricity, water, food, education, and health. Families might also need access to employment. For that reason, houses could be the entry point to see the household situation in a more comprehensive manner.
The house renovation did not stop with the building. The government could also look at household sources of income, children’s education, participation in social insurance, health condition, and needs for business development. Herein lied the point, that poor people were not simply program recipients. They were sources of knowledge about what they truly needed.
From Aid to Safer Life
In the meting, the government also emphasised the importance of “graduation” from poverty. The term described the expectation that households who were beneficiaries of social aid could survive on their own. The idea was obviously important. Poverty eradication policy did not have to make families dependent on aid. But the measure of self-reliance had to be examined more closely and with plenty of caution.
A person who no longer received aid did not always mean that the person’s life was safe. The person’s income could decrease again. Employment could be lost. Cost of day-to-day needs increased. One family member might be sick and that could change the economic situation of a household. For that reason, it was not enough to measure program success from the number of households out of the list of aid recipients.
The government also needed to ask whether households had stable income sources, access to basic services, ability to deal with crisis, and opportunities to maintain descent life. If not, then households who “graduated” from the program might return back to poverty.
People Knew the Problems, the Government Had the Data
The government had the ability to collect large-scale data. The National Bureau of Statistics BPS had the statistical methodology. Sub-national governments had the information about their respective area. Ministries had sectoral data.Yet, equally important was that people had different knowledge – they knew which roads were difficult to access, the increasingly difficult employment opportunities, the changes in prices of basic needs, the public services that were difficult to access, and programs that truly helped and programs that did not address their needs. There was no need to argue about such knowledge.
Government data was necessary so that policies had clear basis. People’s knowledge was necessary so that the numbers did not lose their context. Poverty data never stood on its own.
That was why poverty eradication needed more than simply data update. It was true that the government needed to ensure that inter-agency data were synchronised and that interventions were well targeted. But the process had to be complemented by listening to the people who were in the data. Poor people did not always need the government to explain that they were poor. They experienced it in daily life.
What they needed was policies able to answer why they were poor, what made them poor and why it was difficult for them to get out of poverty, and what supports allowed them to have a safer life.
In the coordination room with the Coordinating Minister for Community Empowerment and district and City officials and heads of sub-national bureau of statistics, academics, parliament members, and minimum participation of disability organisations in Greater Solo Area, poverty might look like a line, percentages, decile, graphs, and annual targets. Outside of the meeting room, poverty had the human face. For that reason, the biggest task for the government was not simply to collect numbers of poverty reduction. The task was to ensure that when the numbers changed, people’s life also changed for the better.
Yanis Family Had to Keep Fighting
As told by a person from Mojo Village in Surakarta who worked part-time in a house, Yani (50 years old) had to work a second job – selling food – in order to afford household needs. She was one of the recipients of Inadequate Housing Program aid from the Family Hope Program, yet by the end of the program, her house was not 100% renovated. She and her husband who worked as online taxi driver had to work harder to afford a truly descent house. (Ast)